PastMode = NUM_BARS
Indicator
Purpose:
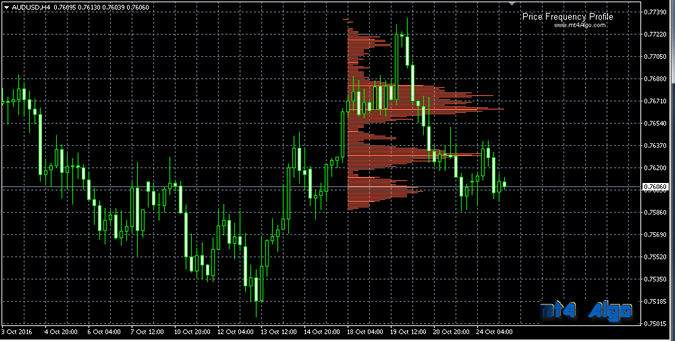
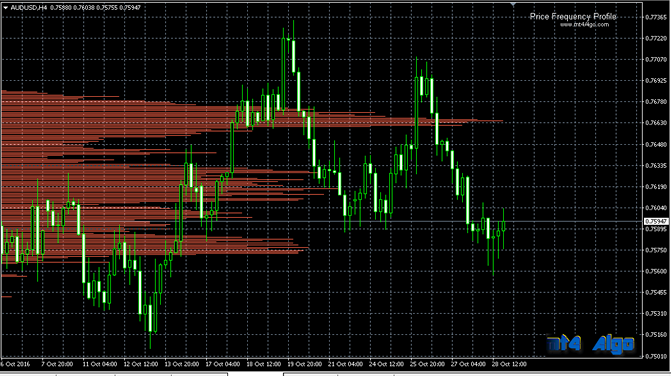
To highlight where price has been most of the time over the past bars specified through the inputs. This is a useful tool for identifying Support and Resistance areas; or areas of “congestion”.
Inputs:
- PastMode – Mode that determines which past bars are considered in the price frequency determination
BARS_VISIBLE – All bars that are shown (are visible) on the chart
NUM_BARS – The number of bars equal to the NumBarsOrHours input. For example if NumBarsOrHours input equals 48, then a frequency profile will be produced for the last 48 bars (regardless of the charts timeframe)
NUM_HOURS – The number of bars equal to the time interval that is equal to the Hours specified in the NumBarsOrHours input. For example if the NumBarsOrHours input is equal to 10, and the indicator is running on a one hour timeframe chart, then a frequency profile will be produced for the last 10 bars. If the indicator were running on a 15 minute timeframe chart, then a frequency profile will be produced for the last 40 bars. (in this mode, the NumBarsOrHours is considered to be in units of hours)
- NumBarsOrHours – if PastMode is BARS_VISIBLE, this input is not used. If PastMode is NUM_BARS then this input specifies the number of bars, If PastMode is NUM_HOURS, then this input specifies a number of hours. See description above
- UpdFreqSeconds – specifies the time interval in seconds between updates to the price frequency profile
- LineColor – specifies the color of the price frequency profile
- LineWidth – specifies the width of the lines making up the price frequency profile
User Notes:
The Price Frequency Profile indicator highlights the most common prices over a specific number of bars or over a specific period of time. It is a useful tool for traders wanting to know exactly and graphically where price has been most often over the bars they specify.
Through the first two inputs, the users specifies which bars they are interested in. This may be:
- all the bars showing on the chart,
- a specific number of bars,
- or all the bars covered by a specific number of hours.
It avoids the inaccuracies of manually drawing “by sight” horizontal lines to highlight support and resistance areas or areas of congestion. The Price Frequency Profile indicator will go over the bars specified and exactly quantify where price has been most often. It then draws a horizontal line at each price proportional to how frequently the price has been visited by “price action”.
System Requirements
To run Metatrader 4 you should be using Windows 2000 or later, with a 2.0 GHz or faster CPU, and at least 512 MB RAM (although 1 GB is recommended). You should have a screen resolution of 1024 x 768 or higher, and an internet connection speed of 56 kbps or faster.
PasMode = BARS_VISIBLE