Purpose:
Trend following strategies are especially appropriate in the Forex
markets where trends may continue for much longer periods than in
other markets.
Any trend following strategy is complicated by the fact that trends
never follow a straight path. This however may be turned into an
advantage as these retracements can be utilized as entry points or for
adding to an already existing position.
These retracements are also referred to as pullbacks, and/or flags
patterns.
The 3 EMA Trend Retrace indicator looks for retracements on a the current chart within the context of a longer term directional bias on a higher timeframe chart. This indicator generates alerts to the screen and includes the ability to send Notifications to ones smartphone*.
*(requires installation of Metatrader app on your phone and configuration of your Metatrader platform that is running the indicator)
Inputs:
- FastMA_Period – number of bars used to calculate the Fast Moving average.
- MediumMA_Period – number of bars used to calculate the Medium Moving average.
- SlowMA_Period – number of bars used to calculate the Slow Moving average.
- HighTimeframe – The High timeframe used for determining the buy or sell bias.
- UseAlerts – If true, Chart alerts and Texts will be generated for trend retracement entry points.
User Notes:
Using EMAs and Price, this indicator recognizes up and down trends followed by brief “retracement entry points”. It can do this in as little as 4 bars on the chart the EA is loaded on.
You may be wondering how an indicator in as little as 4 bars could
possibly call a trend and retracement. The key is to determine an up or down bias from a higher timeframe chart. For example if the higher timeframe chart is showing an upward bias, then on the current timeframe, on average a long term movement in the same direction is likely.
The chart that the indicator is loaded on is considered the current
timeframe. The upper timeframe is user selectable through an indicator
input.
Direction on both higher and current timeframes are determined by
Exponential Moving averages (EMAs) and price action.
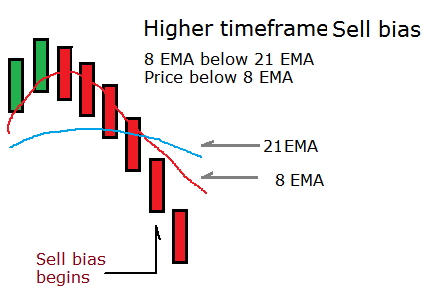
On the higher timeframe chart a buy or sell bias is determined from the relative positions of the 8 and 21 EMAs and price action.
A Sell bias occurs when on the higher timeframe the 8 EMA is below the 21 Exponential Moving Average (EMA) and price is below the 8 EMA. When a Sell bias is in effect only Sell signals may be produced on the current timeframe chart.
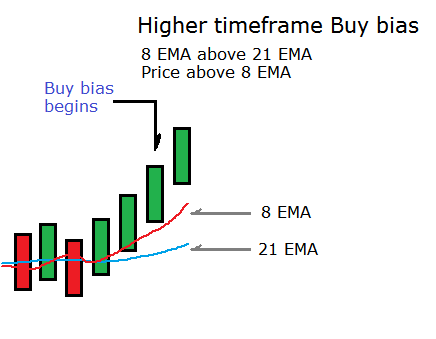
When the 8 EMA is above the 21 EMA and price is above the 8 EMA on the
higher timeframe chart, a Buy bias in in effect and only Buy signals can be produced on the current timeframe chart.
On the current (lower) timeframe chart that we’re running the indicator on, the indicator looks for a certain retracement pattern.
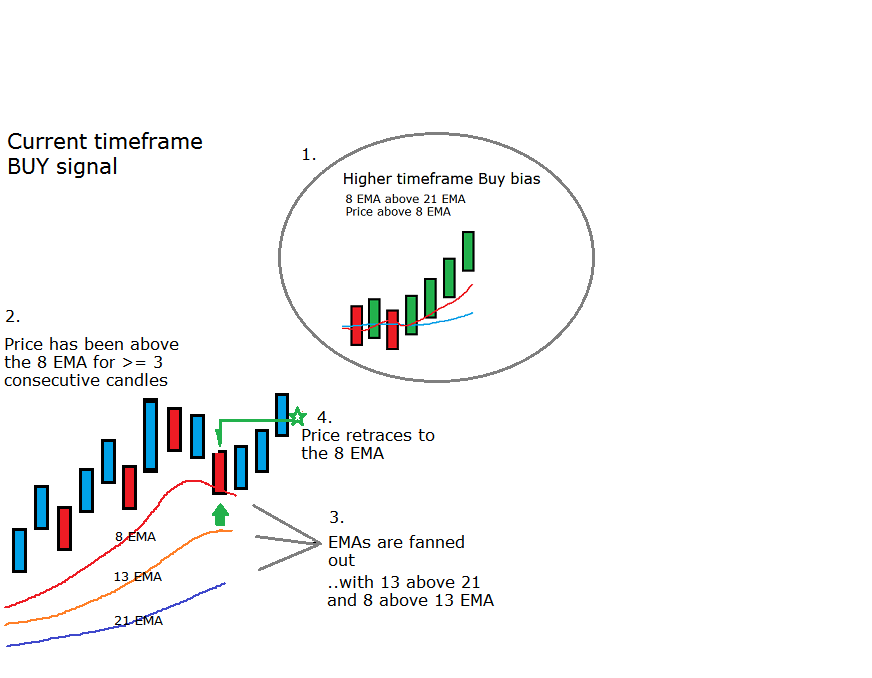
When the higher timeframe bias is for Buy signals, the indicator looks for a sequence where the 13 EMA is above the 21 EMA, the 8 EMA is above th 13 EMA, and price has been above the 8 EMA for at least 3 consecutive candles.
The EMAs should be “fanned out” meaning they have separated from each other.
Following this, if price retraces back down into the 8 EMA a buy signal is generated.
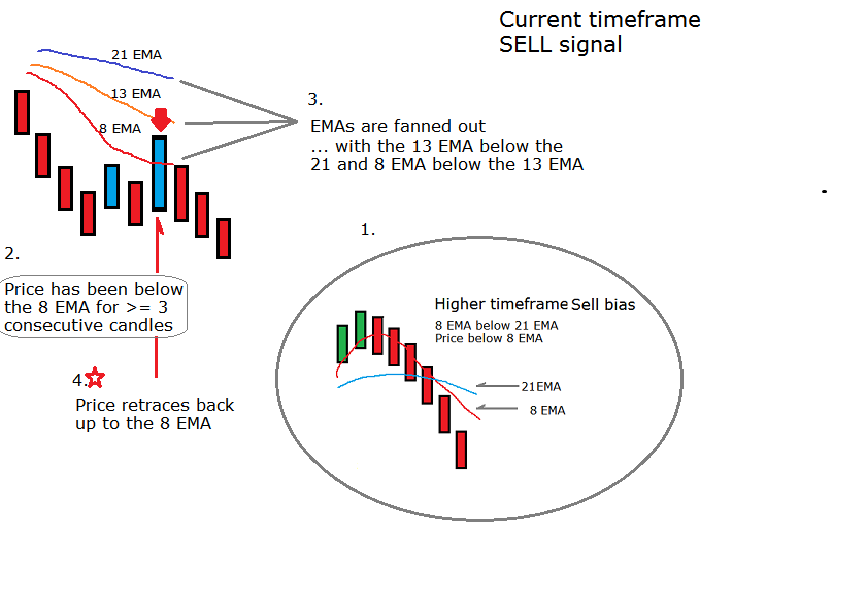
Similarly When the higher timeframe bias is for Sell signals, the indicator looks for a sequence where the 8 EMA is below the 13 EMA and the 13 EMA is below the 21 EMA and have fanned out. Also price will have moved below the 8 EMA for at least 3 consecutive candles.
Following this if price retraces back up into the 8 EMA. a sell signal is generated.
If the retrace is too great, meaning the retrace candle closes on the other side of the 21 EMA, then the setup is cancelled and the indicator begins looking for a new setup.
Likewise, if the bias on the higher timeframe stops or changes, that also prevents any trade signals on the current timeframe.
Signals are represented by an up arrow for a buy signal and a down arrow for a sell signal. These arrows are drawn on the chart by the indicator and are also stored in the indicators data buffers which are accessible to Expert Advisors (EAs).
Depending on the higher time frame selected and the timeframe of the chart the indicator is loaded on, this indicator lends itself for use in both scalping and swing trading strategies.